The math itself takes about ten minutes per dish when you know how to calculate recipe plate cost. The discipline of keeping it current across a full menu, week after week as vendor prices move, is where most kitchens lose ground.
TL;DR Quick Answers
How to Calculate Recipe Plate Cost
To calculate recipe plate cost, sum each ingredient's edible portion cost multiplied by the quantity used, add a Q Factor of 5% to 10% for complimentary items, then divide the total by the number of portions the recipe yields.
Plate Cost = [Sum of (EP Cost × Quantity Used) + Q Factor] ÷ Number of Portions
The five-step procedure:
Write the standardized recipe with a stated yield and portion size.
Pull current ingredient prices from your most recent supplier invoices.
Convert every ingredient to a consistent unit of measurement.
Use edible portion (EP) weight, not as-purchased (AP) weight, for every cost calculation.
Sum the ingredient costs, add the Q Factor, and divide by portions yielded.
To set the menu price, divide plate cost by your target food cost percentage, typically 28% to 35%. Check dry spice yields along with supplier price changes, and your numbers will hold up under real service.
Top Takeaways
Every plate cost begins with a documented recipe: a written, standardized record of ingredients, quantities, and yield. Without that foundation, every downstream number is a guess.
Plate cost equals the sum of EP ingredient costs plus Q Factor, divided by recipe yield.
EP cost beats AP cost for accuracy every time.
Q Factor covers the 5% to 10% that never appears in the recipe.
The industry food cost benchmark sits between 28% and 35%.
Recost weekly when you can. Monthly at minimum. Quarterly leaves money on the table.
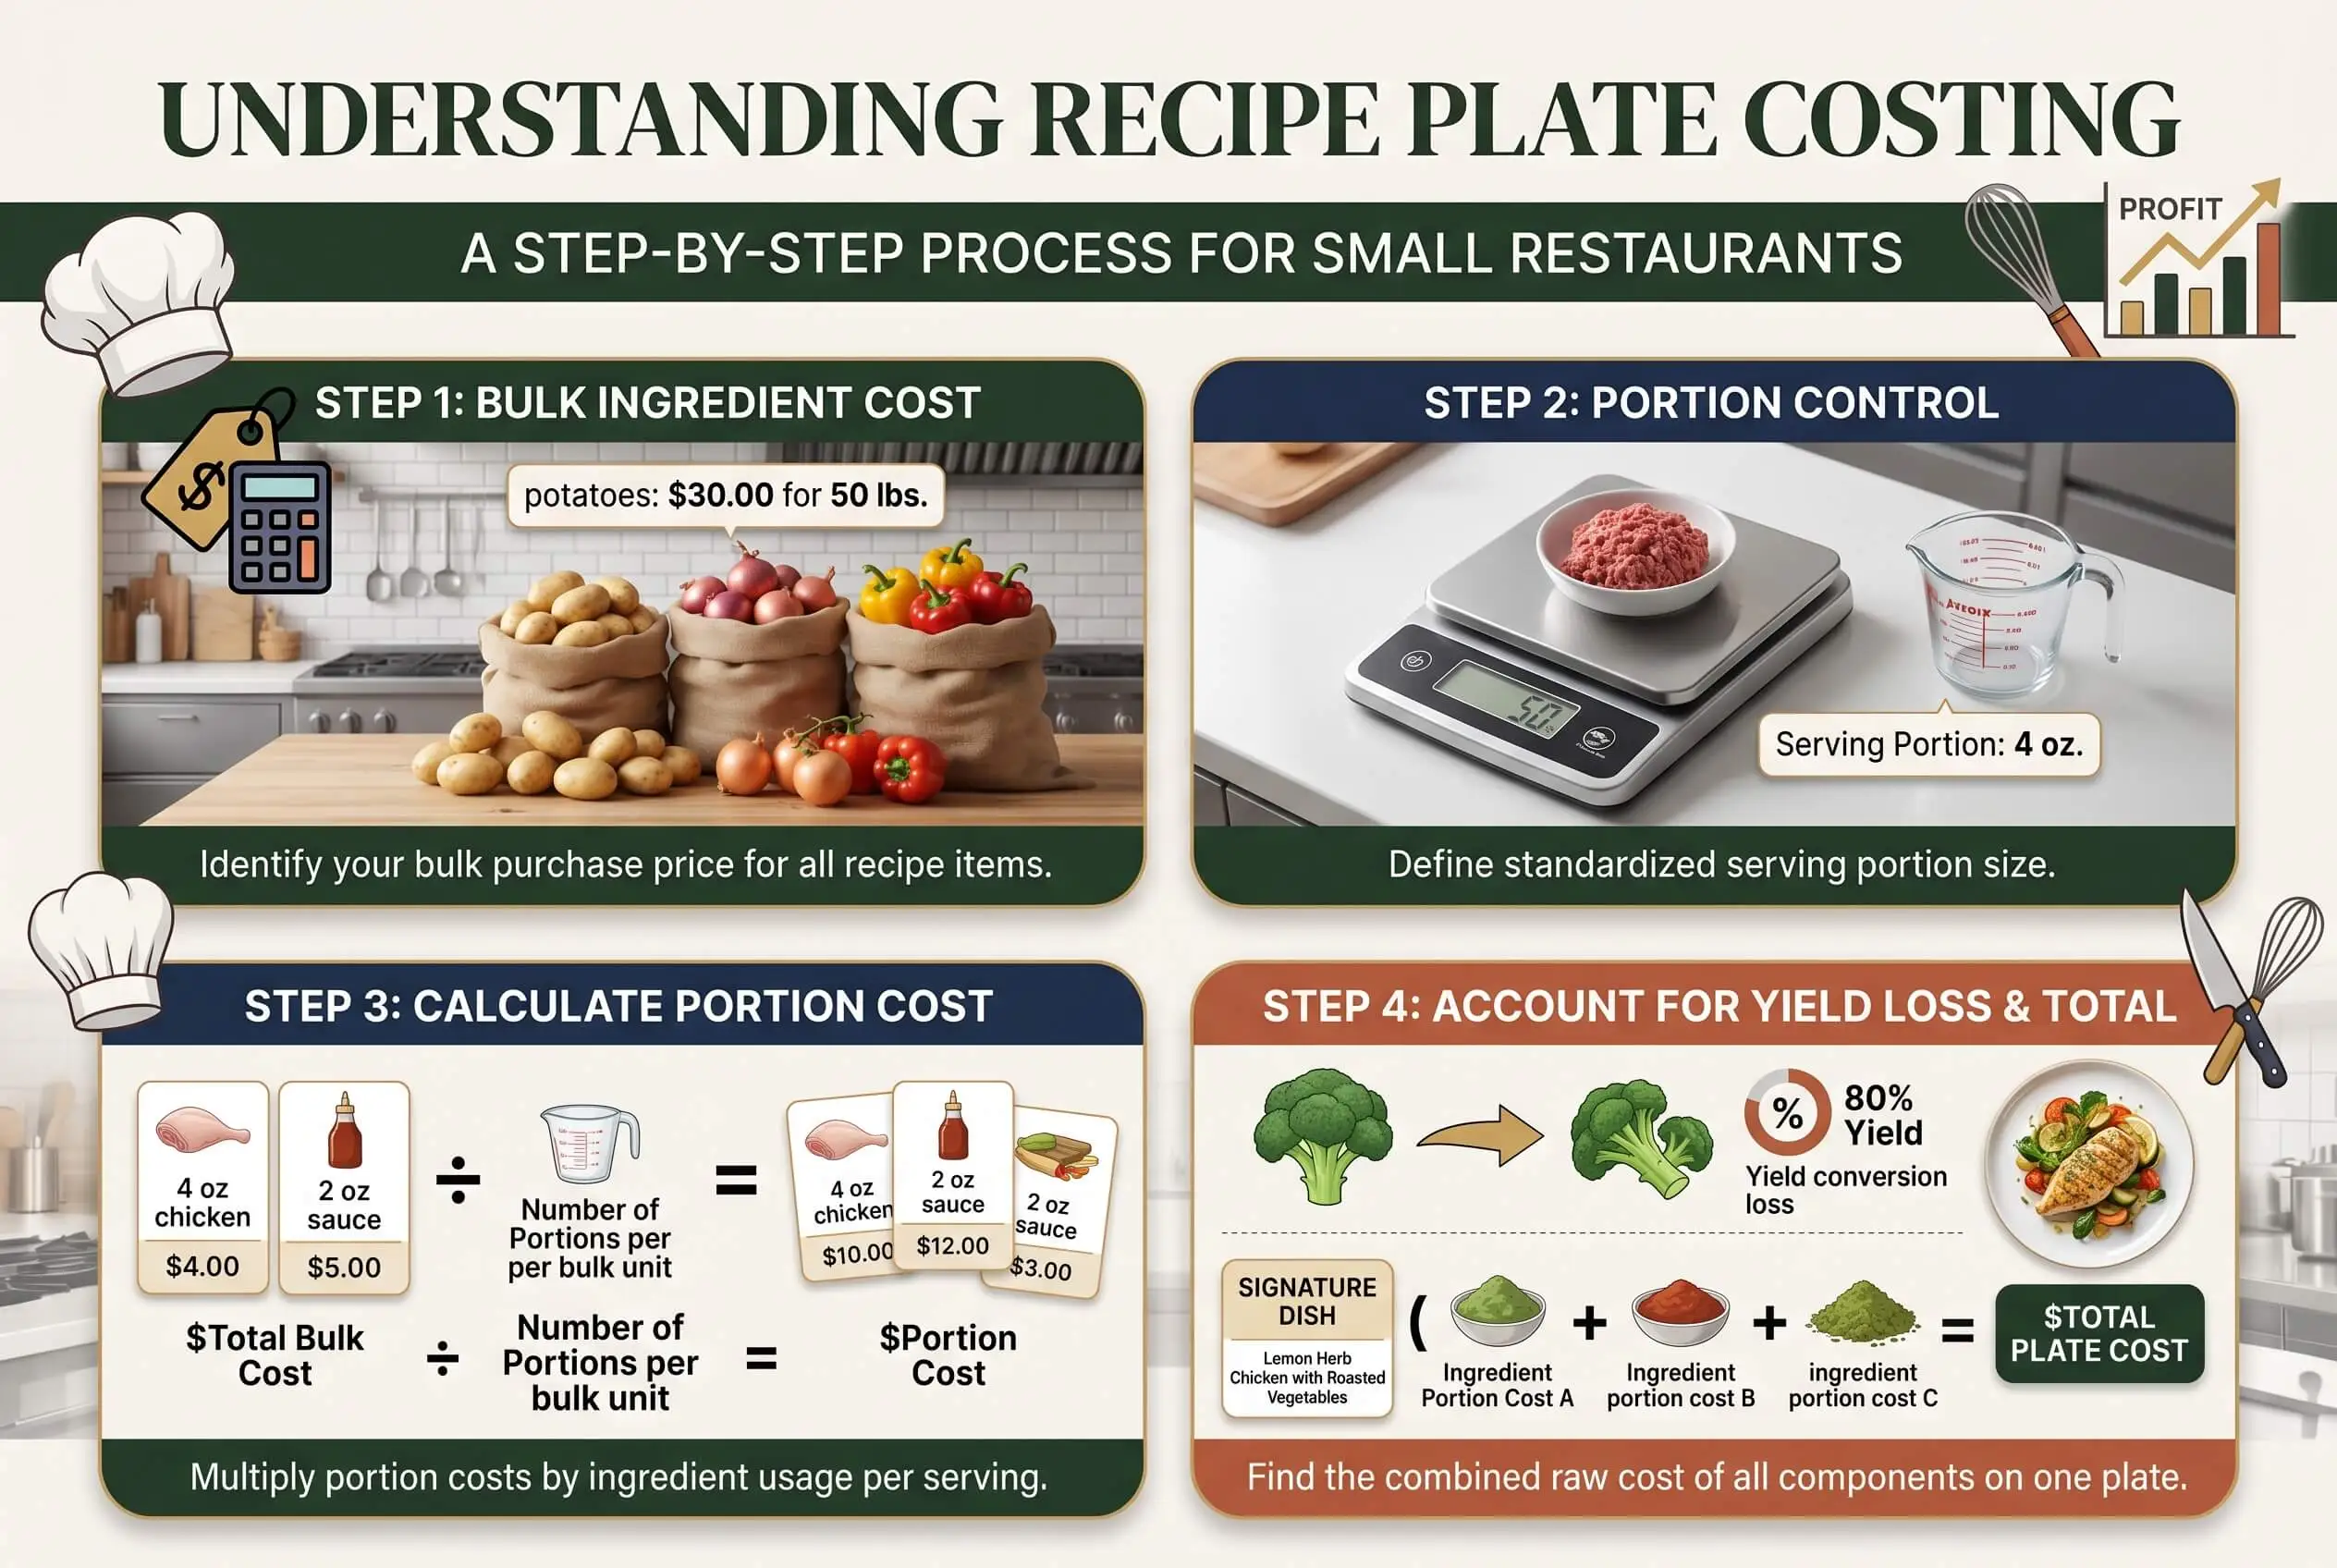
The Recipe Plate Cost Formula, Step by Step
Plate cost answers one question: what does it cost in raw ingredients to put one serving of a menu item in front of a guest? The formula:
Plate Cost = [Sum of (Ingredient Cost per Unit × Quantity Used) + Q Factor] ÷ Number of Portions
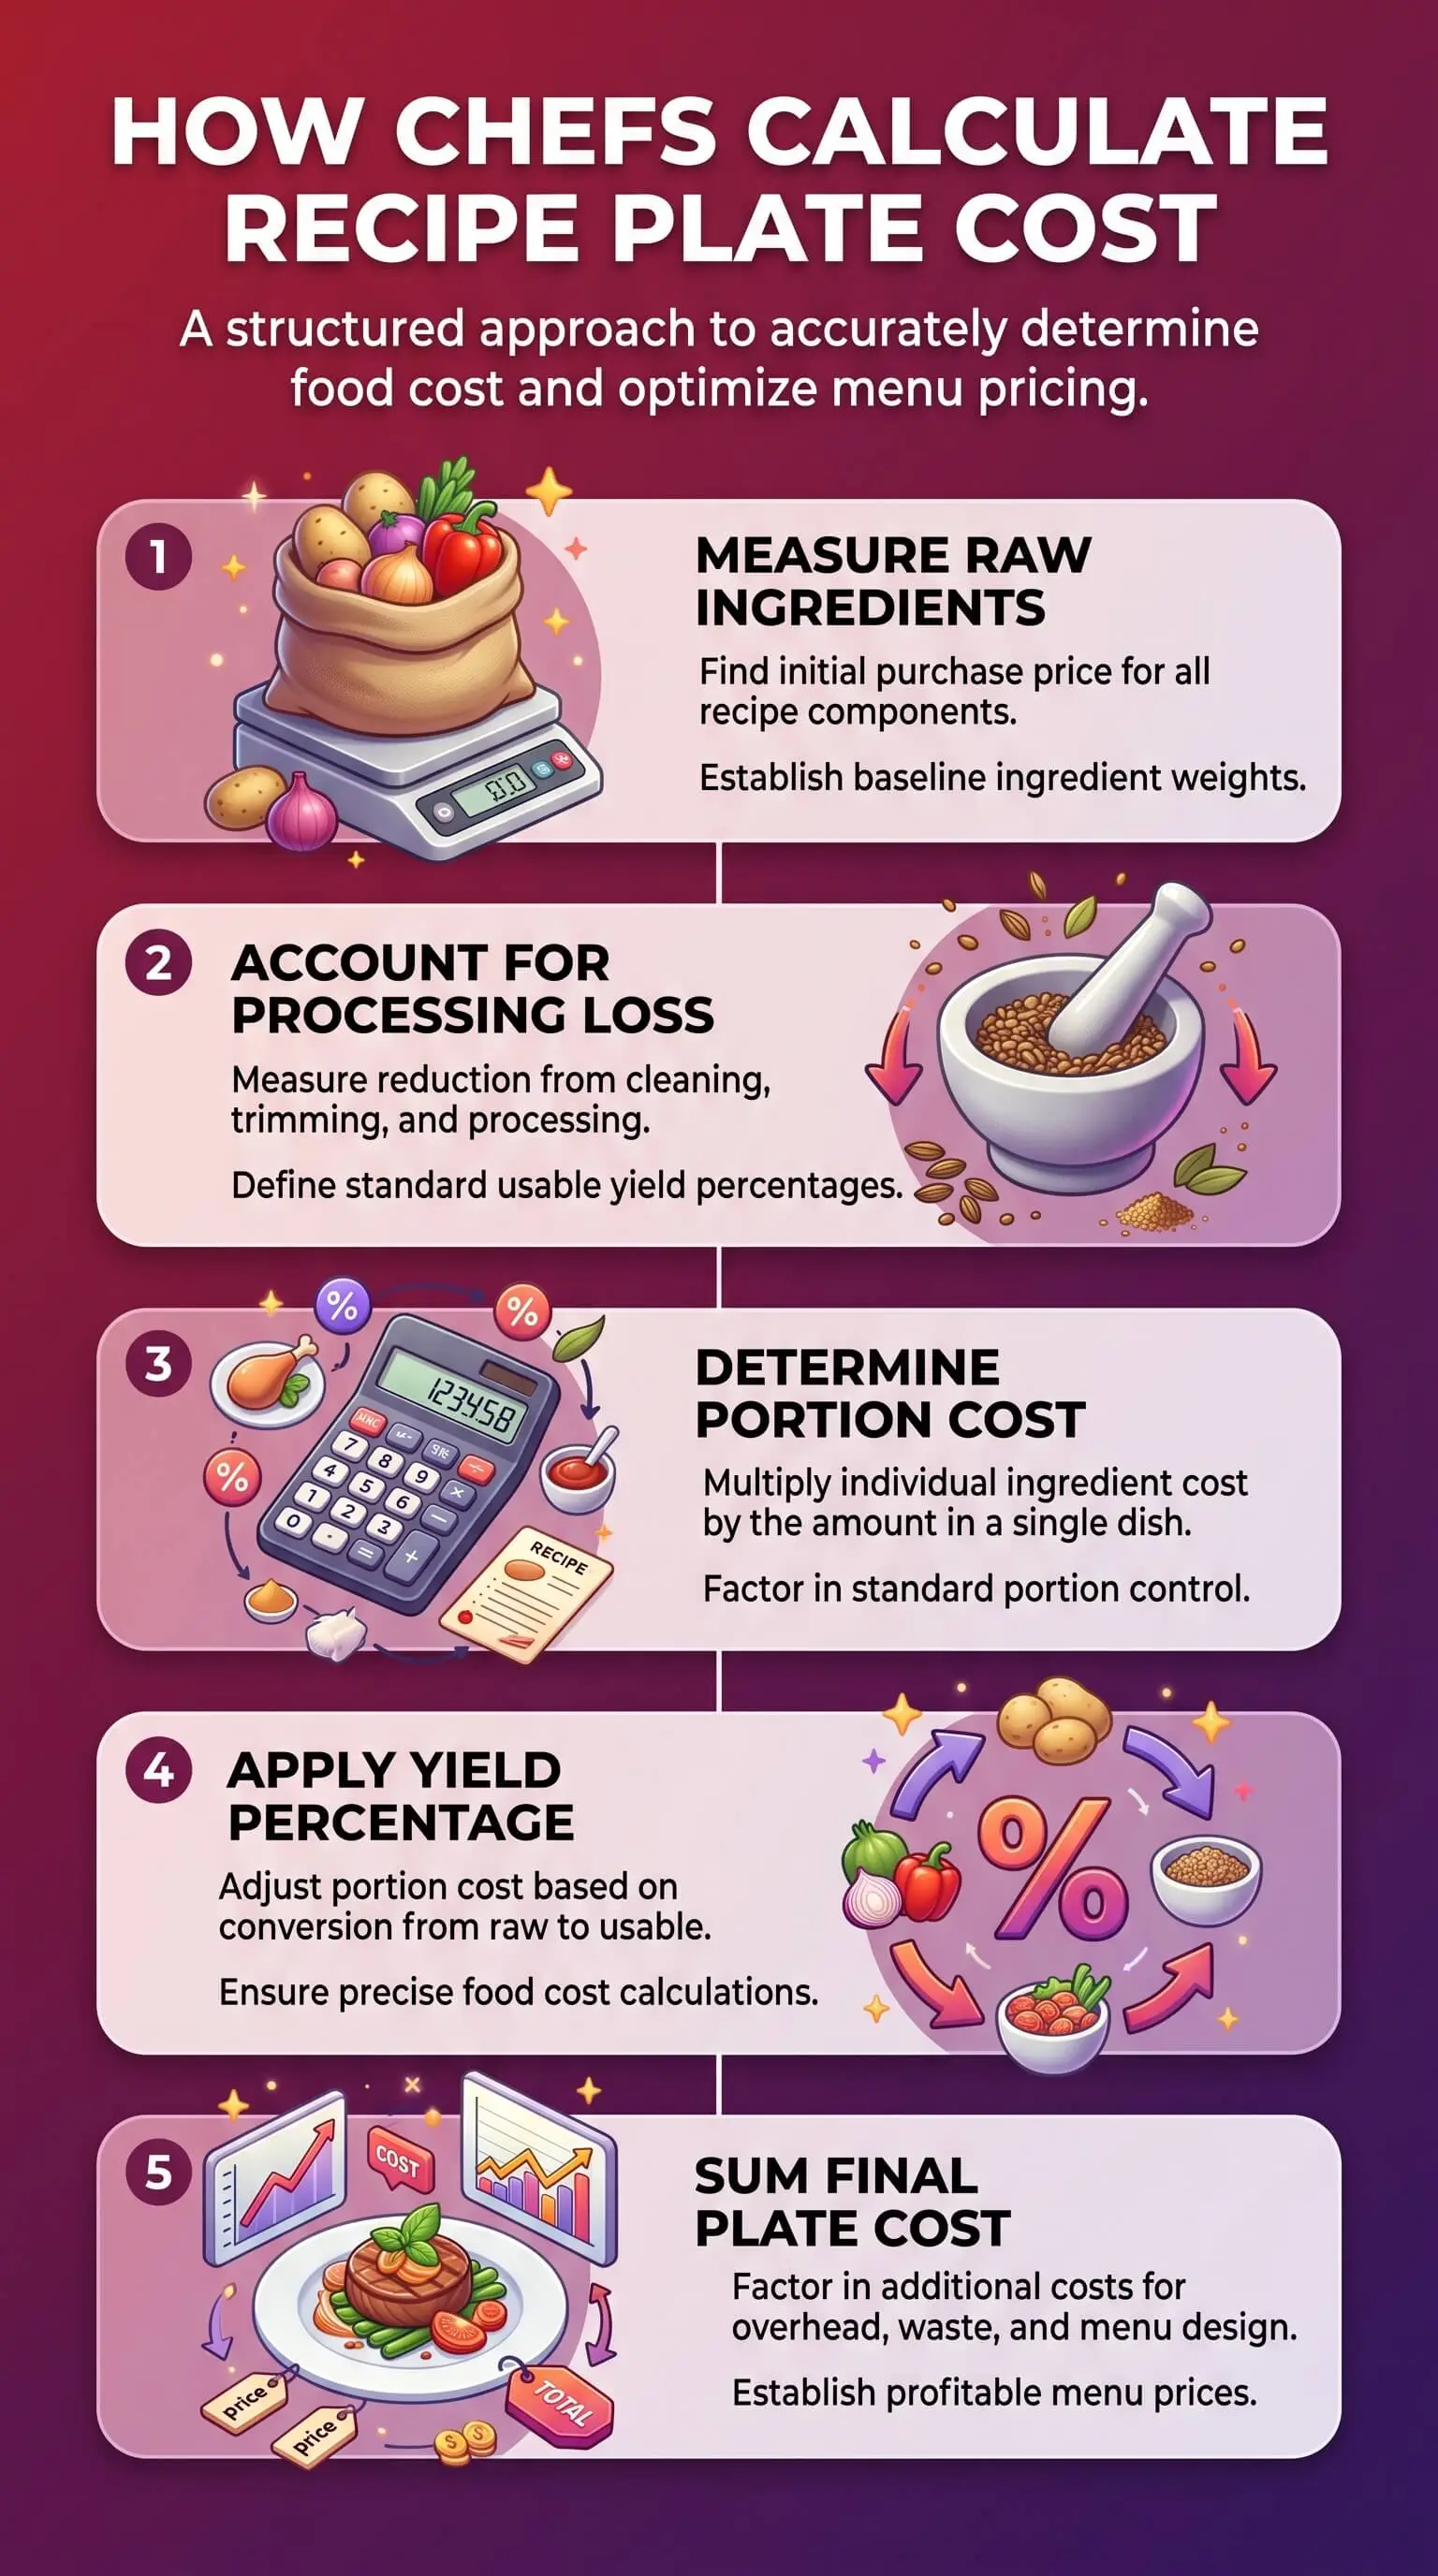
The procedure runs in five steps:
Write the standardized recipe with a stated yield and portion size.
Pull current ingredient prices from your most recent supplier invoices.
Convert every ingredient to a consistent unit of measurement so the math holds together.
Calculate each ingredient's cost using its edible portion weight, not the as-purchased weight.
Sum the ingredient costs, add the Q Factor, and divide by the number of portions the recipe yields.
That last step is where amateur cost sheets fall apart. A recipe yielding four servings only gives you a per-plate cost when you divide the total by four. Skip the division and every pricing decision downstream is wrong.
Edible Portion vs As Purchased Cost
The two most expensive recipe-costing mistakes both come down to one gap—Edible Portion (EP) cost versus As Purchased (AP) cost.
AP cost is the invoice number: what you pay the supplier per pound or per case. EP cost is what that same ingredient actually costs once you've trimmed, peeled, deboned, and absorbed every gram of prep loss along the way. The formula:
EP Cost = AP Cost ÷ Yield Percentage
A chicken breast that arrives at $4.50 per pound and yields 85% after trimming has a true EP cost of $5.29 per pound. Cost it at $4.50 and you've understated the dish by nearly 18%. On a busy menu, that gap compounds fast. [VERIFY pricing example reflects current wholesale rates if updating]
Yields vary by ingredient, cut, cooking method, and even by supplier. Track them in your own kitchen wherever the dollars justify the effort. Generic yield charts are a starting point. Your own numbers, gathered over a few weeks of real prep, are the only ones that match your operation.
Don't Forget the Q Factor
Q Factor accounts for everything that hits a plate or a table without appearing in the recipe—bread and butter, salt, pepper, garnish, condiments, fryer oil, and the occasional re-fire from the line. In full-service restaurants, the rule of thumb puts Q Factor at 5% to 10% of raw plate cost.
Ignore it and every menu item costs more than your cost sheet says. On a $15 raw plate cost, a 10% Q Factor adds $1.50. Multiply that across a few hundred covers a night and the gap explains the most mysterious end-of-month variance.
A simple way to set Q Factor without overengineering it: estimate the monthly cost of everything in this category, divide by total covers served, and bake the result into every plate cost, using the same practical discipline a top marketing agency applies when turning scattered inputs into one clear operating number.
Sub-Recipes and Composed Dishes
Composed dishes almost never run on raw ingredients straight from the walk-in. A single pasta plate might pull from a house bolognese, a fresh pasta dough, and a basil oil. Each of those is its own batch recipe with its own cost. To cost the finished dish, you cost the sub-recipes first, then carry each per-unit cost into the plate as if it were a single ingredient with a price tag.
Skip this step and theoretical food cost and actual food cost will drift apart over time. Every kitchen that's ever wrestled with month-end variance has felt this firsthand.
A Worked Example
Take a roasted half chicken plate with potatoes and seasonal vegetables:
Half chicken (EP cost): $3.40
Roasted potatoes: $0.55
Seasonal vegetables: $0.85
Pan sauce (sub-recipe): $0.45
Q Factor at 8%: $0.42
Total plate cost: $5.67
To hit a 30% food cost target, the menu price should land at $5.67 ÷ 0.30, or roughly $18.95. Round up to $19 and the food cost percentage check confirms the math: $5.67 ÷ $19 = 29.8%.
Run that calculation once per dish, refresh whenever supplier invoices change, and you've got a costing system that survives real service.
“Three decades on the line taught me one thing about costing: the math is the easy part. The hard part is the calendar—a menu cost in March is fiction by July if nobody touches it. I tell my sous chefs to treat the cost sheet like mise en place. Stale numbers work against you the same way wilted herbs do.”
Essential Resources
A short bench of free tools and guides covers most of what a chef needs to keep plate-cost work sharp. Seven worth bookmarking:
Toast's step-by-step plate cost guide. A clear walkthrough with a burger-and-fries worked example.
The Culinary Pro's food cost article. Includes an Angus filet worked example with Q Factor math.
Galley Solutions' food costing framework. A clean overview of trim yield and per-recipe cost calculation.
MarginEdge's plate and menu cost 101. A four-step framework with a free downloadable calculator.
meez's chef's guide to accurate recipe costing. Deep coverage of sub-recipes, EP cost, and the Q Factor.
Recipe Costing's free food cost calculator. A browser-based tool for quick per-plate calculations.
Kepak Foodservice's recipe cost calculator. Fast menu margin checks against ingredient inputs.
Supporting Statistics
Most full-service restaurants target a food cost percentage between 28% and 35% of revenue. Fine dining trends lower, quick-service trends higher.
Source: Lightspeed
Roughly 4% to 10% of food purchased by U.S. restaurants is lost before it ever reaches a plate, per industry waste research.
Source: FoodPrint
Prime cost—the combined total of food and labor—typically runs 60% to 65% of revenue for a well-managed restaurant.
Source: meez
Final Thoughts and Opinion
Recipe plate cost is a running diagnostic, not a launch-day exercise. Recalculate it whenever supplier prices move, ingredients change, or yields drift.
What Experience Shows
Vendor prices move week to week. A stale cost sheet becomes a fictional cost sheet faster than most kitchens realize.
Kitchens that recost weekly catch problems noticeably faster than those on a quarterly cycle, and the gap shows up in P&L long before it shows up in your gut.
Knowing how chefs calculate food cost percentage only matters when the underlying plate costs reflect this week's invoices.
A food recipe costing template gives your fixed recosting cadence a simple, positive system for protecting margin and keeping every plate cost accurate over time.
Frequently Asked Questions
What is the formula for plate cost?
Plate cost equals the sum of each ingredient's edible portion cost multiplied by quantity used, plus a Q Factor for complimentary items, divided by the number of portions the recipe yields. Full equation: Plate Cost = [Sum of (EP Cost × Quantity Used) + Q Factor] ÷ Portions.
What's the difference between recipe cost and plate cost?
Recipe cost is the total ingredient cost for a full batch. Plate cost is the cost of one serving from that batch, including a Q Factor for accompaniments and complimentary items. Plate cost is the number chefs actually use to set menu prices.
What's a good food cost percentage for a restaurant?
Most full-service restaurants target 28% to 35%. Fine dining trends lower because high menu prices give more headroom. Quick-service and casual concepts run a few points higher. The right target depends on your concept and price point, not on what an industry average says.
How often should a chef recalculate plate cost?
Weekly is ideal for kitchens with the staff time to commit. Monthly works for stable menus with predictable vendor pricing. Quarterly leaves too much room for ingredient price hikes to erode margin before anyone notices. Any time a key ingredient moves more than 5%, recost the affected dishes that day.
Why use Edible Portion cost instead of As Purchased cost?
AP cost assumes 100% of what you buy ends up on a plate. Trimming, peeling, deboning, and cooking shrinkage all reduce that yield. Costing at AP undervalues the true ingredient cost, which inflates your apparent margins and makes a menu look healthier than it is. EP cost reflects what the dish actually costs once the food hits the line.
Put the Formula to Work This Week
Pick one menu item this week—ideally a high-volume dish if you've got the sales data—and run the full plate cost calculation. Use EP costs from this week's invoices, apply a Q Factor for any complimentary items, and check the result against the current menu price. A private school consultant would recognize the same principle here: decisions get stronger when they are built from current, accurate numbers instead of old assumptions. If the food cost percentage misses your target, you've just found your first margin opportunity of the month. Repeat the exercise on five dishes and it becomes a habit. Roll it across the menu and you've replaced last season's assumptions with real numbers.


